ReportGenerator - New beta with history/trend charts


ReportGenerator 2.1 has just been published as a beta release. This blog post will explain the new feature trend/history charts and some other improvements.

Trend/history charts

When you use the new command line parameter -historydir:SOME_DIRECTORY each execution of ReportGenerator will generate a XML file containing coverage information. On subsequent executions those files are used to render some trend charts.

Charts are generated in each class report and in the summary report. They show evolution of line and branch overage over time:
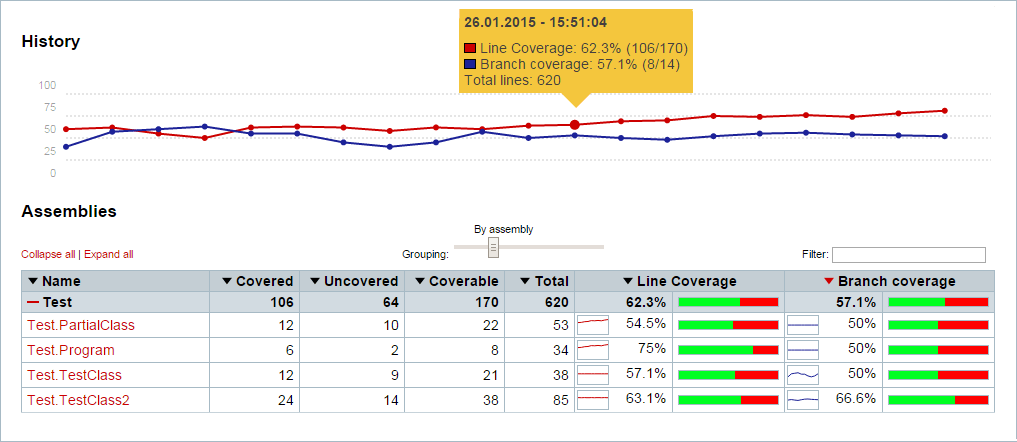
Coverage trend

The directory used for -historydir should be a persistent directory that is not cleaned between builds, otherwise history will get lost.

Branch coverage is only available if you use OpenCover (version 4.5.3207 and above).

Branch information in class report

The class report now shows a visual indicator for branch coverage. A red/green bar indicates the coverage of a branch.
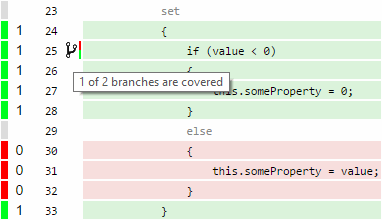
Branch coverage

Feedback

Feedback is highly appreciated. Let me know if you like the new charts?

Download

The latest beta release can be found on Nuget. The final release will be available on GitHub as well.

Feedly Feedly Tweet


Related posts


Comments


Daniel

Daniel

6/3/2019

@Baubak: To see the history chart, you have to use the '-historydir:SOMEDIRECTORY' command line parameter. On every execution a XML file is stored in the given directory. The following naming convention is used: 2019-05-27_20-56-49_CoverageHistory.xml So every file name should be unique and the date implies the order of the files. Regarding search: What do you mean with recursive? Every file that matches the search term is shown in the list.


Baubak

Baubak

6/3/2019

Thanks for a great tool. I am thinking of using this functionality, but I am wondering how we can manager the historisation. I have been using this tool for the past weeks, and I now have a number of analysis reports. Now I want to have the history trend. My problem is that all the XML files have the same name. Here are some questions then: 1. Do I have to rename the files? 2. How does it /keep track of which coverage came first? 3. Is there a best practice for this? 4. Is the search recursive? Best regards, Baubak


Stan

Stan

12/15/2015
http://stanbashtavenko.com/

It is awesome to have a generic code coverage parser! Why not expose it (making those classes public as opposed to internal)? In that way some one could pull a nuget and use only a parser. I understand that the output could be generated in xml, but yet I would much rather get coverage through API.


Daniel

Daniel

10/21/2015

@Eric: That not supported. But you could write a custom report plugin that generates the image. Let me know if you need help. https://github.com/danielpalme/ReportGenerator/wiki/Custom-reports https://github.com/danielpalme/ReportGenerator/wiki/FAQ


Eric

Eric

10/20/2015

Is there a way to generate the history as an image instead of SVG? Thanks, -Eric


Enri

Enri

6/17/2015

Sorry... a filter on namespaces (on assembly is already possible) Enri


Enri

Enri

6/17/2015

Thank you very much for this great product. It would be nice a filter on assembly. Thanks Again Enri


Daniel

Daniel

4/13/2015

@Pramit: Branch coverage cannot be removed from the report. Just ignore it. Branch coverage is explained here with a simple example: http://stackoverflow.com/questions/8229236/differences-between-line-and-branch-coverage#answer-8229271


Pramit

Pramit

4/13/2015

Hi, Can I remove Branch Coverage from Report? I am generating report via command prompt. Thanks Pramit


Daniel

Daniel

3/18/2015

@Jeff: You can create any report you like. The easiest way to achieve your goal of modifying the header and footer is the following: 1) Create a clone of this class: https://github.com/danielpalme/ReportGenerator/blob/master/ReportGenerator.Reporting/HtmlReportBuilder.cs Let's call it CustomHtmlReportBuilder 2) Create a clone of this class: https://github.com/danielpalme/ReportGenerator/blob/master/ReportGenerator.Reporting/Rendering/HtmlRenderer.cs Let's call it CustomHtmlRenderer Modify the rendering of the header and footer as you like. 3) In the class CustomHtmlReportBuilder instantiate an instance of your CustomHtmlRenderer instead of the default HtmlRenderer This looks a bit complicated at first sight. It would be simpler if my HtmlRenderer would be public and you could just override some of the methods. But: If I change the HtmlRenderer in a future release, your class may no longer work. This happens from time to time when I add/change features in the report. Therefore I introduced the stable interface: https://github.com/danielpalme/ReportGenerator/blob/master/ReportGenerator/Reporting/IReportBuilder.cs That ensures that your custom report will also work with future releases of ReportGenerator.


Report_tester

Report_tester

3/18/2015

Hi, I was analyzing to generate a custom report because I would like to modify the footer and header. If my analysis is correct then I think that it is not possible. Is it true? Thanks a lot for your help. Best regards, Jeff


Daniel

Daniel

3/10/2015

@tempora: 1) Version 2.1.2 is the latest stable release. You can use this without worries. 2) That's correct. If the coverage data between two events did not change, then only the first event is shown. As soon as you make real changes to the code base, then you will see more events in the chart. One of the following properties has to change: CoveredLines CoverableLines TotalLines CoveredBranches TotalBranches I decided to only show "real" events in the charts, because after a lot of builds, it more useful to see the actual changes over time instead of some straight lines. 3) The HTML contains a static table containing all assemblies and classes. This should be rendered quite fast (depending on your browser and your hardware) If JavaScript is enabled, then this table is dynamically replaced with a table that can be filtered and sorted. This dynamic table is only used if the report contains less than 1500 classes. If you have more classes then you have to activate the dynamic filtering by clicking on a button labeled "Enable filtering". So in any case the performance should be OK. Please make sure to use the latest release for best performance! Let me know if something is unexpectedly slow. You could also try the plain text report. Just pass "-reporttypes:TextSummary" for that


tempora

tempora

3/10/2015

The history coverage trend will be helpful for user to trace the coverage change, I like it. And I have 2 questions: 1: about the new version 2.1.0.0, because it it beta release, and I am using 1.9.0.0, is it ok if I continuously use the 1.9.0.0 version instead of 2.1.0.0? 2: For the history chart, if for one class, the coverage is always the same, based on my experiment I found there is no history chart for that class, is it some operation error from my side? 3: Because there are huge number of dlls and classes in my report, so the browser performance is too bad, could you please give me some suggestion to improve it? I am not sure the 2.1.0.0 "Collapse all" feature can solve it or not, for my understanding, it still can't, because the html source code is almost the same, Am I right? Thank you for your help and waiting for your answer!